



Most field service dashboards tell you what happened. Jobs created, jobs closed, average time on site, technician count active today. These are activity metrics. They measure whether things are occurring, not whether the service network is performing.
The distinction matters because activity metrics and performance metrics diverge in the situations that matter most. A network with high job volume and fast closure times can simultaneously have a poor first-time fix rate, significant AMC revenue sitting uncaptured, and parts delays that erode customer satisfaction in ways that show up as churn rather than service complaints.
At OEM scale, the difference between tracking activity metrics and tracking performance metrics is the difference between knowing the service network is busy and knowing whether it is working.
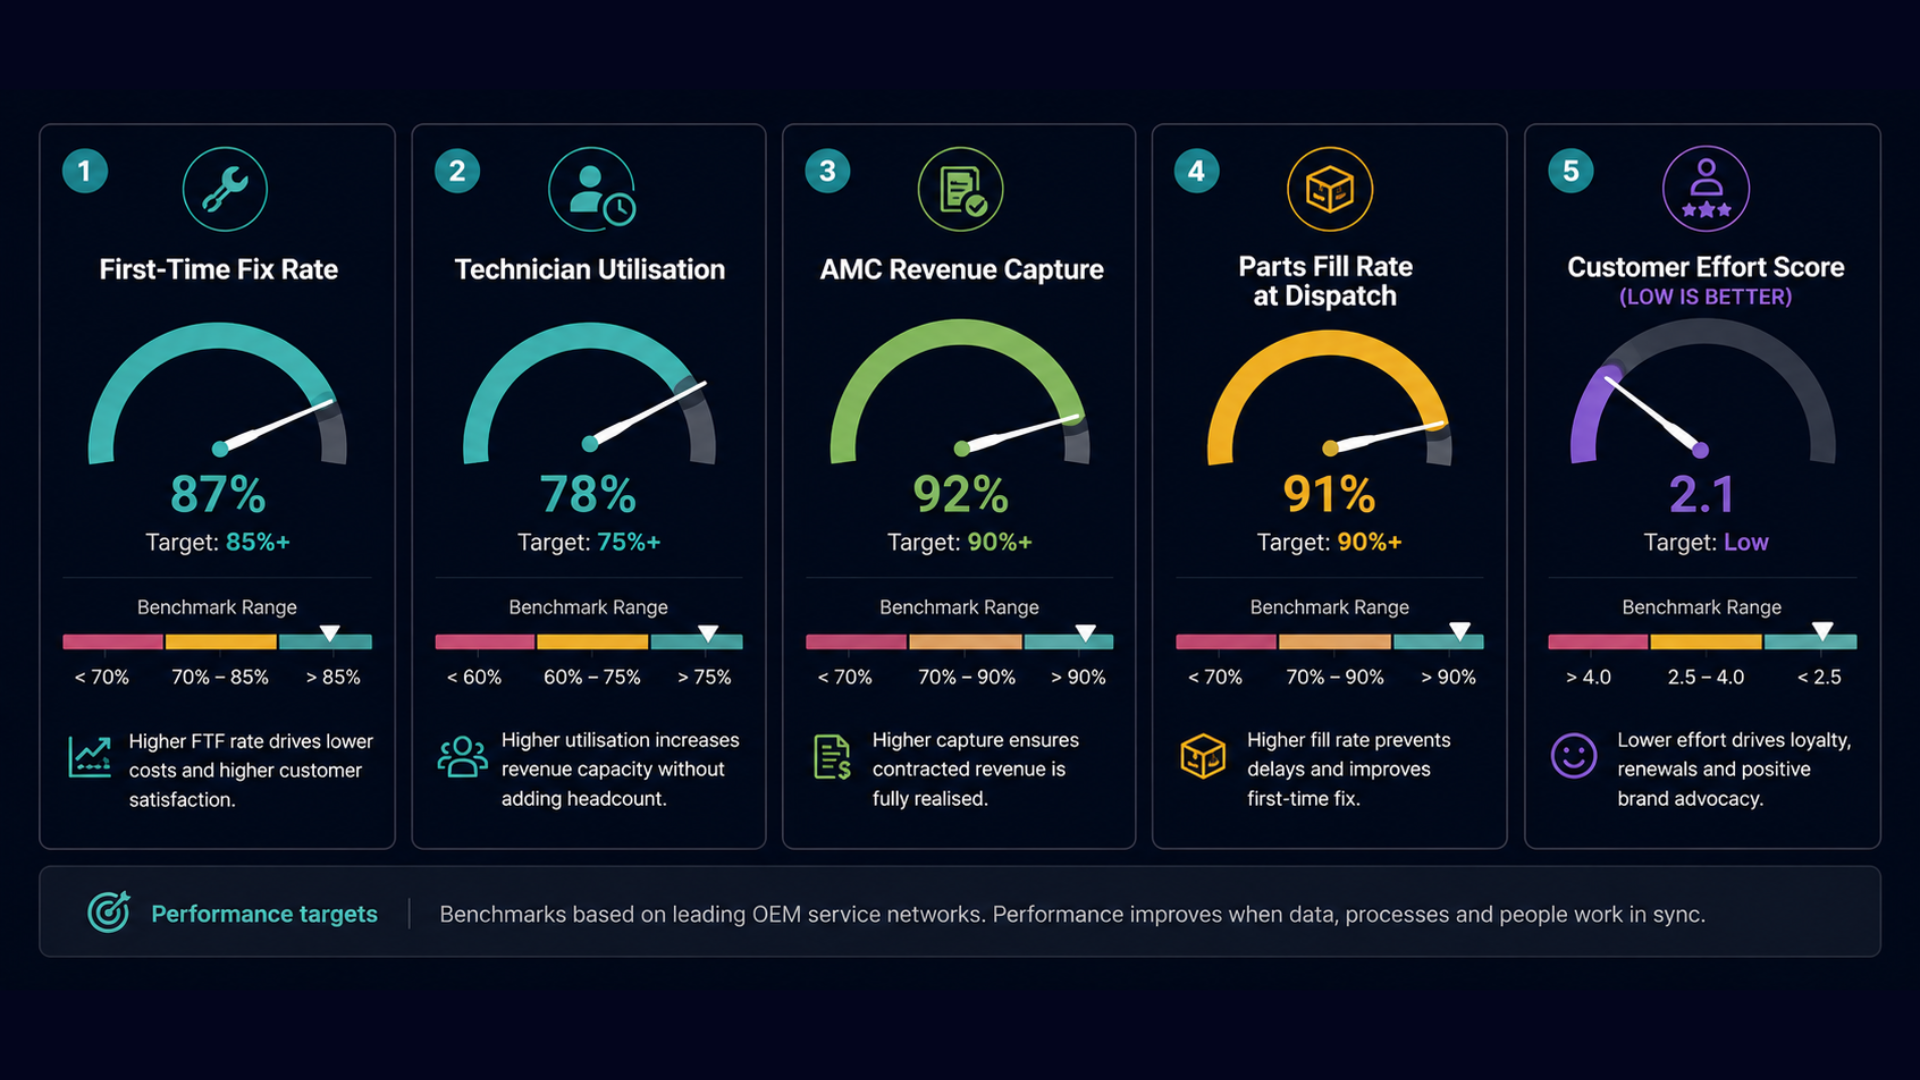
This piece covers the five metrics that actually predict service network performance at OEM scale, why they are more difficult to surface than standard Field Service Management (FSM) dashboards suggest, and what moving them requires.
Why Standard FSM Dashboards Miss the Metrics That Matter
Standard FSM dashboards are built around the data that the FSM platform controls: job records, technician check-ins, time stamps, and completion status. These are the metrics the platform can measure reliably because they come from the platform's own data.
The metrics that predict service network performance at OEM scale require data that lives outside the FSM platform: warranty records in the ERP, parts inventory across the dealer network, AMC contract status in the CRM, customer satisfaction data from post-service surveys, and historical job records that enable pattern analysis across the network over time.
A generic FSM platform that does not integrate with ERP and CRM in real time cannot surface first-time fix rate accurately because it cannot see whether the job was completed correctly until the customer calls back. It cannot surface AMC revenue capture because it does not have access to the AMC contract data. It cannot surface parts fill rate at point of dispatch because it does not have real-time visibility into dealer inventory.
The platforms that surface these metrics are the ones that were designed with the ERP and CRM integration that makes them calculable, not the ones that track the metrics available from job records alone.
The Five Metrics That Actually Predict OEM Service Network Performance
1. First-Time Fix Rate
First-time fix rate is the percentage of service jobs completed correctly on the first visit without requiring a return visit, a parts escalation, or a technician replacement. It is the single most predictive metric of service network quality and one of the most direct drivers of service cost.
The cost of a failed first-time fix is not just the return visit. It is the technician time for both visits, the parts handling cost if the wrong part was ordered, the customer satisfaction impact, and in warranty contexts the potential for the manufacturer to absorb costs that a correct first visit would have avoided.
In a large service network, a one-percentage-point improvement in first-time fix rate across 5 million annual job cards is a significant operational saving that does not appear in any single budget line but shows up across parts costs, technician utilisation, and customer satisfaction simultaneously.
First-time fix rate cannot be measured accurately without ERP integration. The FSM platform knows whether the job was closed. Only the ERP knows whether the warranty claim was accepted, whether the customer called back within the follow-up window, and whether a subsequent job was raised for the same issue within the SLA period. Accurate first-time fix rate requires connecting these data sources.
A leading consumer electricals OEM achieved an 85% app-based job closure rate within three months of deploying Technician Plus across its service network. That metric is not job completion rate. It is verified job closure, meaning the technician confirmed completion through the app with photographic evidence, the ERP confirmed the warranty or service contract was valid, and no follow-up job was raised for the same issue within the measurement window. That specificity is what makes it a performance metric rather than an activity metric.
2. Technician Utilisation
Technician utilisation is the percentage of a technician's available working time that is spent on productive job activity versus travel, waiting, administration, or idle time. At enterprise scale, small differences in utilisation across a large technician population translate into significant revenue capacity.
A network of 5,000 technicians each working 250 days per year at an average of 6 billable hours per day has a theoretical revenue capacity based on those hours. Every percentage point of utilisation lost to avoidable travel, inefficient job allocation, or administrative overhead represents a direct reduction in that capacity.
Technician utilisation is difficult to improve without accurate data on where utilisation is being lost. Aggregate utilisation figures hide the zone-level and skill-level variation that reveals where allocation decisions are creating idle time in one area and overload in another. The utilisation data that enables action is granular: by region, by dealer, by technician skill tier, and by job category.
This level of granularity requires a platform that tracks technician activity at the required resolution and connects it to the job allocation data that explains why utilisation looks the way it does in each segment.
3. AMC Revenue Capture
Annual Maintenance Contract revenue is one of the highest-margin revenue streams available to OEM service organisations. An AMC customer has already committed to a service relationship. The revenue is contracted. Capturing it requires ensuring that every AMC renewal is actioned, every AMC service visit is scheduled within the contracted window, and every AMC customer interaction is an opportunity to identify and address issues before they become warranty claims or service failures.
Most OEM service networks leave AMC revenue on the table not because customers choose not to renew but because the data required to proactively manage the AMC relationship is distributed across systems that do not talk to each other. The AMC contract is in the CRM. The service history is in the FSM platform. The renewal date is in the billing system. No single platform has the full picture, so the proactive outreach that drives renewal and the scheduling that delivers contracted visits does not happen systematically.
A leading consumer electricals OEM achieved 27% AMC order growth within three months of deploying Technician Plus, by connecting AMC contract data with service visit scheduling and creating automated workflows that ensured every AMC customer received their contracted service visits within the required window and received renewal outreach before contract expiry. The 27% growth was not from selling more AMC contracts. It was from capturing the revenue that existing contracts entitled the organisation to receive.
4. Parts Fill Rate at Point of Dispatch
Parts fill rate at point of dispatch measures the percentage of jobs where the required spare parts are confirmed available and allocated to the technician before dispatch, rather than being identified as unavailable after the technician arrives at the customer site.
This metric is the upstream predictor of first-time fix rate. A technician dispatched without the correct parts cannot complete the job correctly on the first visit. The first-time fix failure is determined at the point of dispatch, not at the customer site.
Improving parts fill rate at point of dispatch requires real-time integration between the FSM dispatch decision and the dealer inventory system. The dispatch decision needs to check whether the parts required for the job type are available in the technician's vehicle or at a nearby dealer location before confirming the technician assignment and the customer appointment. This check cannot happen after dispatch. It needs to be part of the allocation decision.
Generic FSM platforms that do not integrate with dealer inventory in real time cannot surface this metric accurately or use it to influence dispatch decisions. OEM FSM platforms that integrate with the dealer parts inventory in real time can flag parts availability gaps before dispatch and either resolve them or adjust the appointment accordingly.
5. Customer Effort Score for Service Interactions
Customer effort score measures how much effort a customer had to expend to get their service issue resolved: how many contacts they had to make, how long they waited for updates, how clearly they were communicated with, and whether the issue was resolved on the first service interaction.
At OEM scale, customer effort score is a leading indicator of warranty claim behaviour, AMC renewal rate, and brand loyalty that service experience drives. Customers who experience high-effort service interactions — multiple contacts to get a job scheduled, no proactive communication about technician arrival, no confirmation that the issue was resolved — are more likely to raise warranty disputes, less likely to renew AMC contracts, and less likely to repurchase from the same OEM.
Customer effort score requires data from beyond the FSM platform: customer contact records, satisfaction survey results, and the correlation between service experience variables and downstream commercial outcomes. It is the metric that connects operational service performance to revenue impact most directly, and it is the one most consistently absent from standard FSM dashboards.
Why These Metrics Are Hard to Surface Without the Right Architecture
Each of the five metrics above requires data that lives in at least two systems: the FSM platform and either the ERP, the CRM, the dealer inventory system, or a combination of all three.
First-time fix rate requires FSM job data plus ERP warranty and follow-up data. Technician utilisation requires FSM activity data plus job allocation data at the granularity of skill and zone. AMC revenue capture requires CRM contract data plus FSM scheduling data. Parts fill rate at dispatch requires FSM dispatch data plus real-time dealer inventory data. Customer effort score requires FSM interaction data plus customer feedback data and downstream commercial outcome data.
A platform that syncs with these systems periodically can calculate approximate versions of these metrics at a point in time. A platform that integrates with them in real time can surface them continuously and use them to influence operational decisions as they are being made.
The difference is the difference between a performance report and a performance management system. The report tells you where you were. The management system influences where you are going.
This is why OEM FSM platforms need real-time ERP and inventory integration as an architectural requirement rather than an integration feature. The metrics that drive performance cannot be surfaced without it.
How to Use These Metrics to Prioritise FSM Investment
The five metrics above are also a prioritisation framework for FSM investment. The metric with the largest gap between current performance and target performance, and the clearest line to a revenue or cost impact, should determine where FSM investment is focused first.
An OEM with a first-time fix rate significantly below target should prioritise the parts integration and technician skill matching that drives first-time fix improvement before any other FSM capability.
An OEM with significant AMC revenue uncaptured should prioritise the CRM integration and automated scheduling workflows that close the AMC capture gap before broader FSM transformation.
An OEM with low technician utilisation driven by zone-level imbalance should prioritise AI allocation that optimises across the full network rather than within regional silos.
In each case, the metric points to the specific capability that will move it, and that capability points to the specific integration or platform feature that needs to be in place. This is a more reliable path to FSM ROI than evaluating platforms on feature breadth and selecting the most capable general-purpose solution.
Vishleshan AI's Technician Plus is built to surface and move the metrics that matter for large OEM service networks. It integrates with ERP and dealer inventory in real time, tracks performance at the granularity that enables action, and has been proven at Fortune 500 scale with documented outcomes including 85% app-based job closure rate, 27% AMC order growth, and 3x spare parts revenue within three months of deployment. Book a Consultation